I was tasked with improving the product that was released a year ago and was not accepted/underperformed poorly in terms of quarterly sales goals. In my heuristic evaluation of the SI App I found many UX issues in terms of a missing landing page and global search, inconsistent information hierarchy, architectural + page flow issues. Upon further investigation both internally (Product Marketing + Sales interviews) and externally (limited user interviews), I received more questions than answers on the value of this app. How was this app different from others offered in the Product suite? Why should we spend money on it?
My Role
Since the Social Insights PM had recently left the org, I contributed as a Lead Product Designer + Product Manager role. With guidance from the CPO and the VP of Strategy, we improved the product value + overall UX which led to an increase in sales (+250% YOY). This is the process/strategy I utilized:
Spoke to any interested customers and existing users (focus groups) and asked them how they leveraged the SI data?
Identified primary users (persona development) + secondary users and their pain points
Came up with the user stories to help define the tasks/flows
Sprint planning with user research and delivery dates for mockups, prototype and final hand-off
Designed user flows, architecture, mockups, visual design and protoype for the SI dashboard
The Process
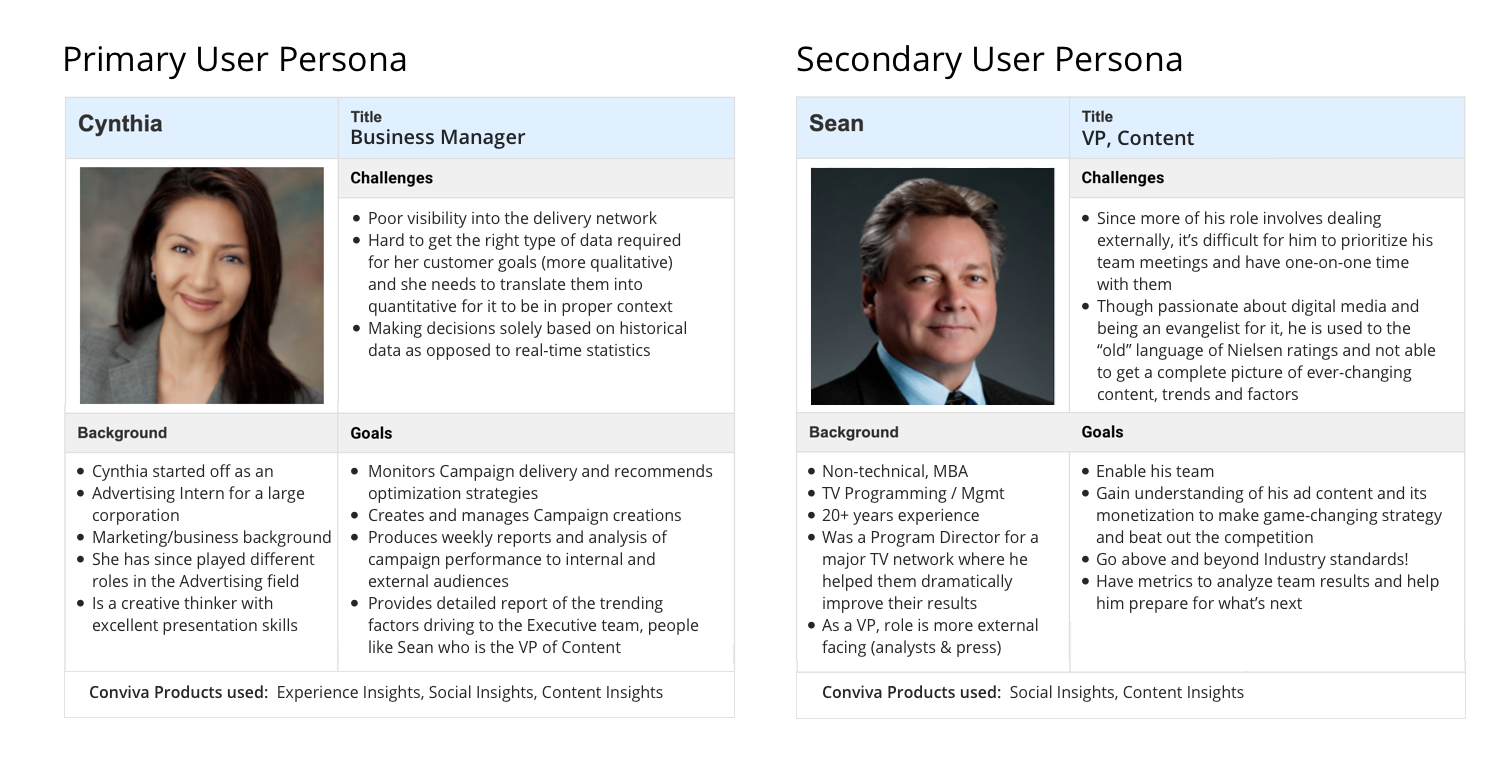
Research: Persona Development
Defining the Target User - No one internally (Product, Sales) could provide a clear picture of the primary users for this app. Since we had recently lost the Product Manager for this product, I had limited insights into the app. Furthermore, we only had a limited number of customers using it (newly launched in 2019). When I reached out to one of the key customers via Sales, we found out who the primary users (Business Managers) were and what areas of the app (Leaderboard, Campaigns) they used.
A new Target User - During my conversations with the Business Managers, we covered their interactions with the existing SI product including challenges, goals, hand-offs and inquired about other team dynamics at an org level. Q: Would this product be helpful to another team? How so?
A: Yes, of course, we typically send out these performance reports to our management, specifically the Executive team. They would love to see the big picture and the breakdowns on how Ads, Campaigns and Videos are performing on Social Media and what trends/factors are driving that? However, we have to create separate screens / slides in our presentation report for the aggregated data view. This is the most time consuming part of our job!
This conversation led us to speak to add Executives, specifically a VP of Content (also a buyer persona) as part of our secondary target users. This user would be able to review overview of Audience KPIs, performances/trends of videos, ads and campaigns on Social Media.
Research: KPI, Metrics and Dimensions
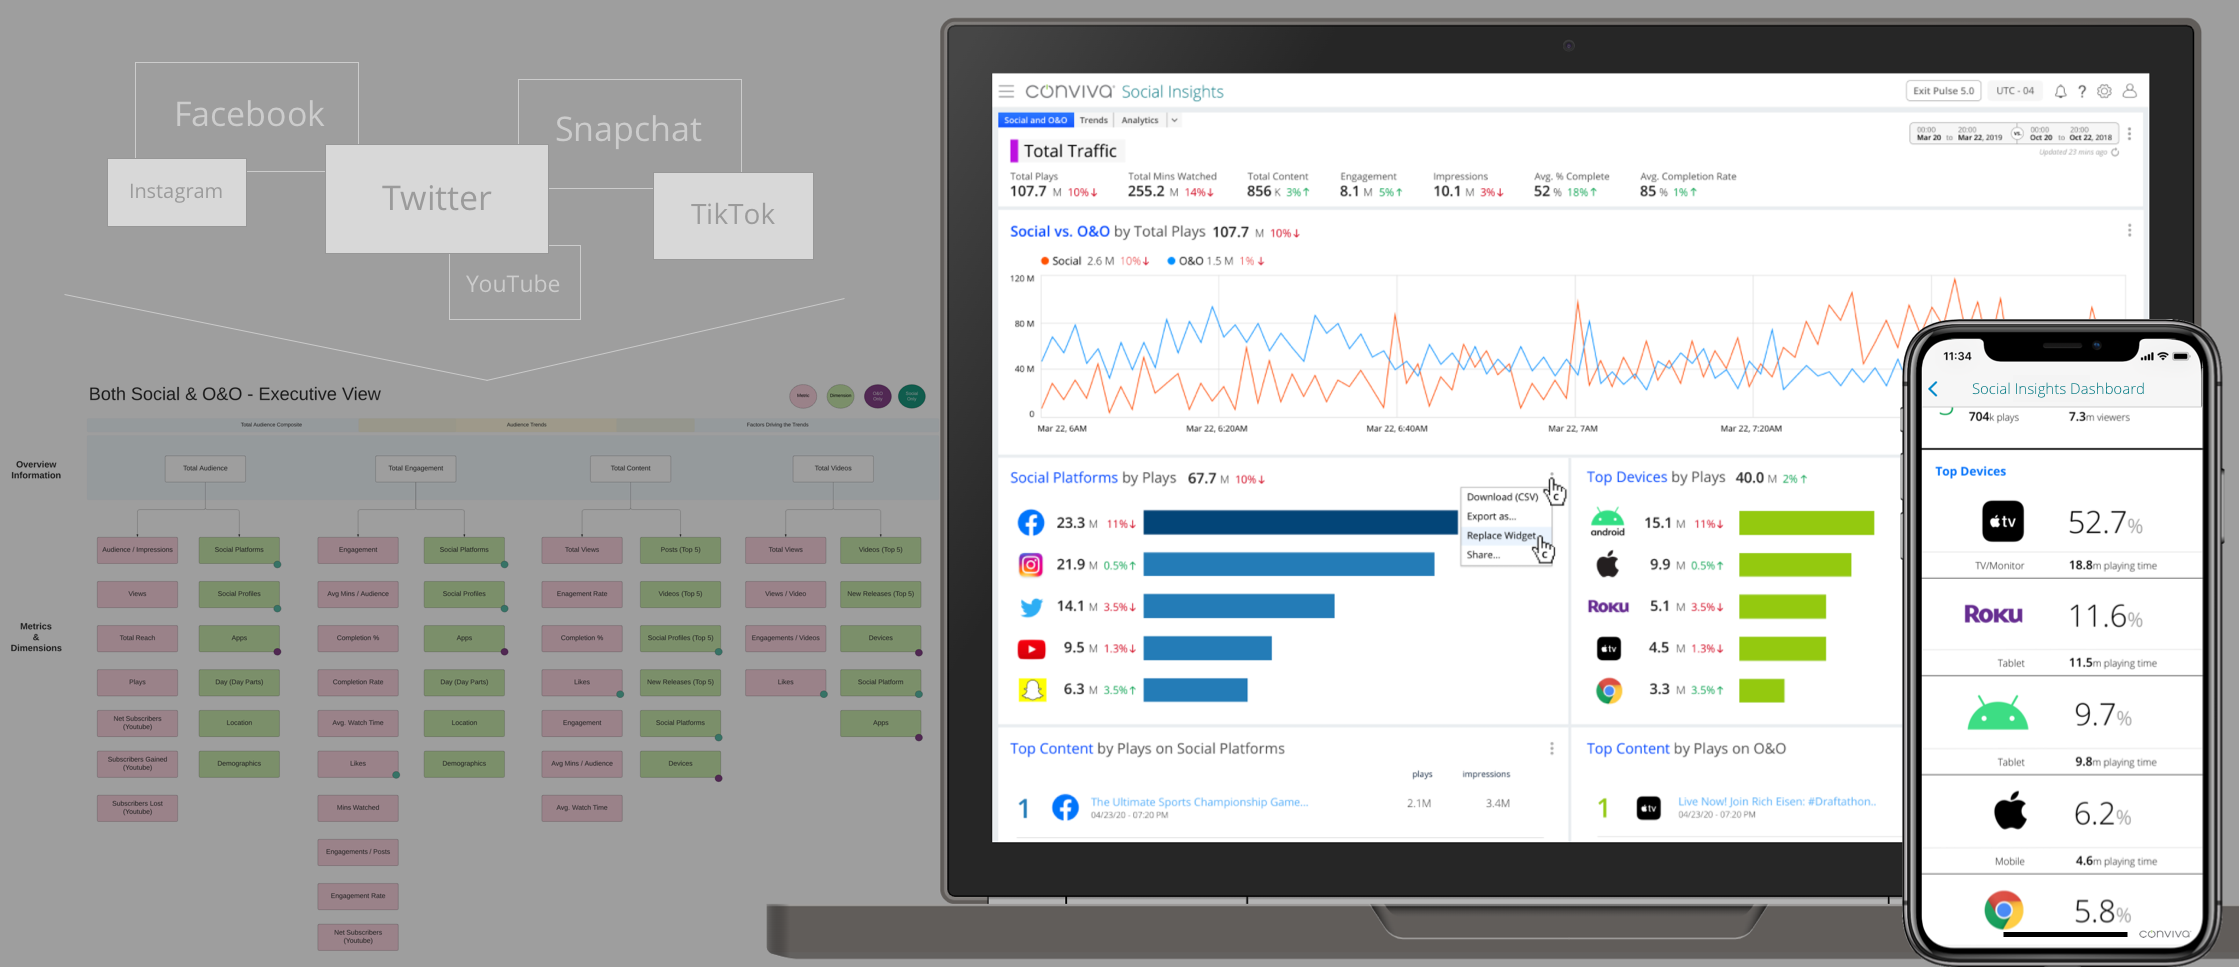
Another aspect of this project was to research the KPIs and metrics our primary users leverage in their reports. We receive data from all leading social media platforms + their respective O&O apps so each platform has their own taxonomy. Working with our CPO and VP of Strategy (Social Media), I categorized them into 3 major categories (Total Audience, Audience Trends and Factors Driving Trends) and sorted each metric under one of these categories. The 3 major categories were based off of patterns on how our users built their reports.
Then these metric groupings were put together to tell a compelling story about the performance of audience and assets on social media (FB, YouTube, IG, TikTok, etc.) in the UI; workflows and data visualization. Each set of metrics were partnered with a set of dimensions (one-to-many). Understanding the relationship of the KPIs and the hierarchy of the metrics and dimensions was a critical part of this project. This enabled me to build out the dynamic UI which gave Ad Ops Users the capability to build out data visualizations using their own combination of metrics and dimensions. This essentially would be a major aspect of their SI Dashboard.
User Stories
- From my research, I was able to identify the personas for SI, the KPIs and metrics being tracked in their reports. From this, there were 3 primary user stories derived for what our users expected from the app:
As a Business Manager, I want to see the performance metrics of my Total Audience across Social Media & O&O Apps so I can provide reports on what are the current trends driving content
As a Business Manager, I want to be able to create and share custom reports with custom metrics and visualizations
As a VP of Analytics, I want to be able to see an overview of Total Audience performance across Accounts and Trending Factors so I can predict which Content/Ads will retain/increase engagement
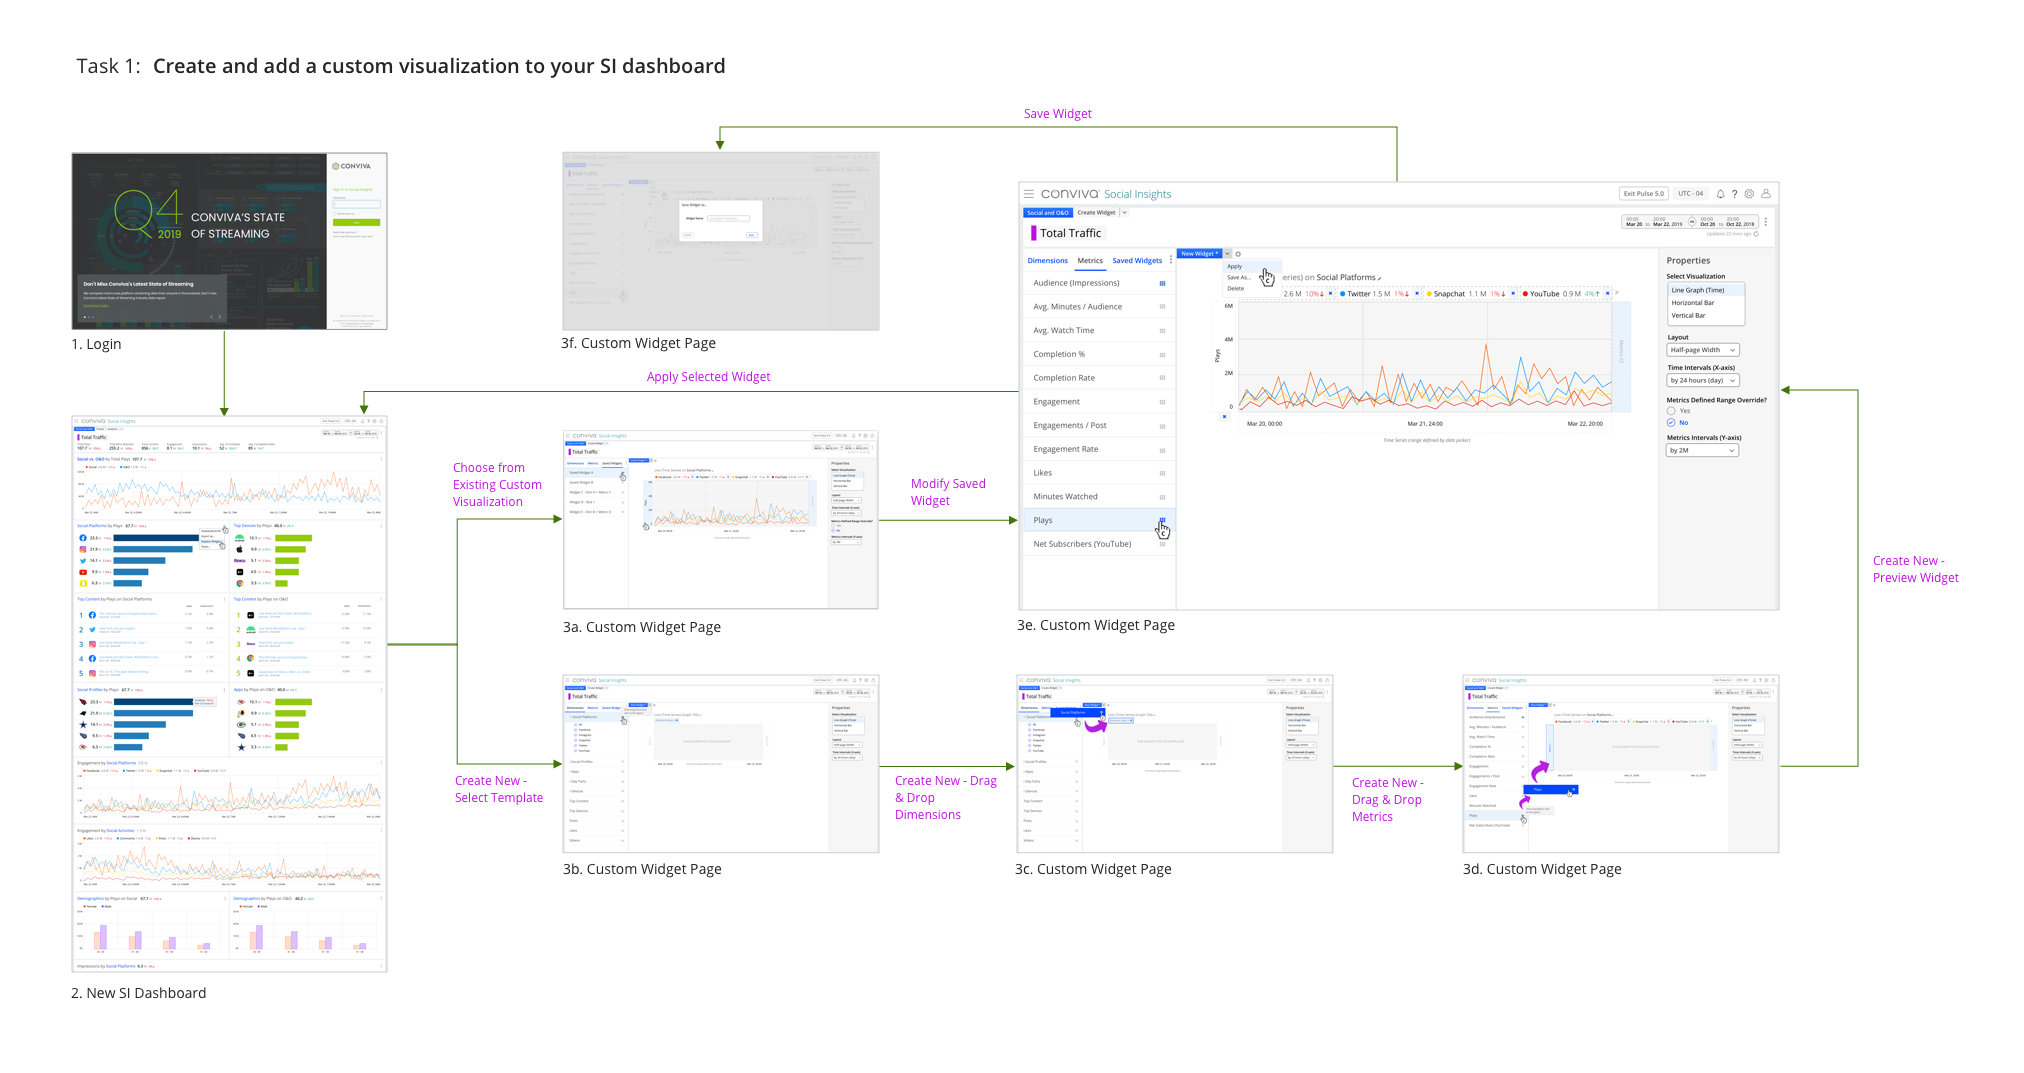
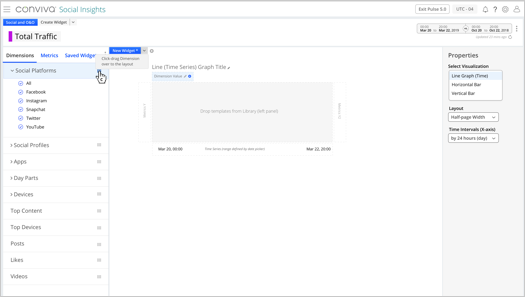
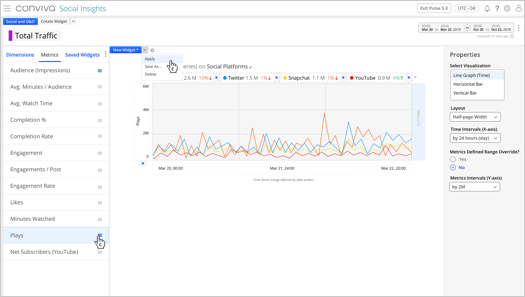
Task 1 for User Story #2
- Our more advanced and technically savvy Business Managers wanted the ability to create visualizations from a custom set of metrics based on their needs. So Task 1 focused on creating visualizations from the custom metrics library and adding it to their SI Dashboard.
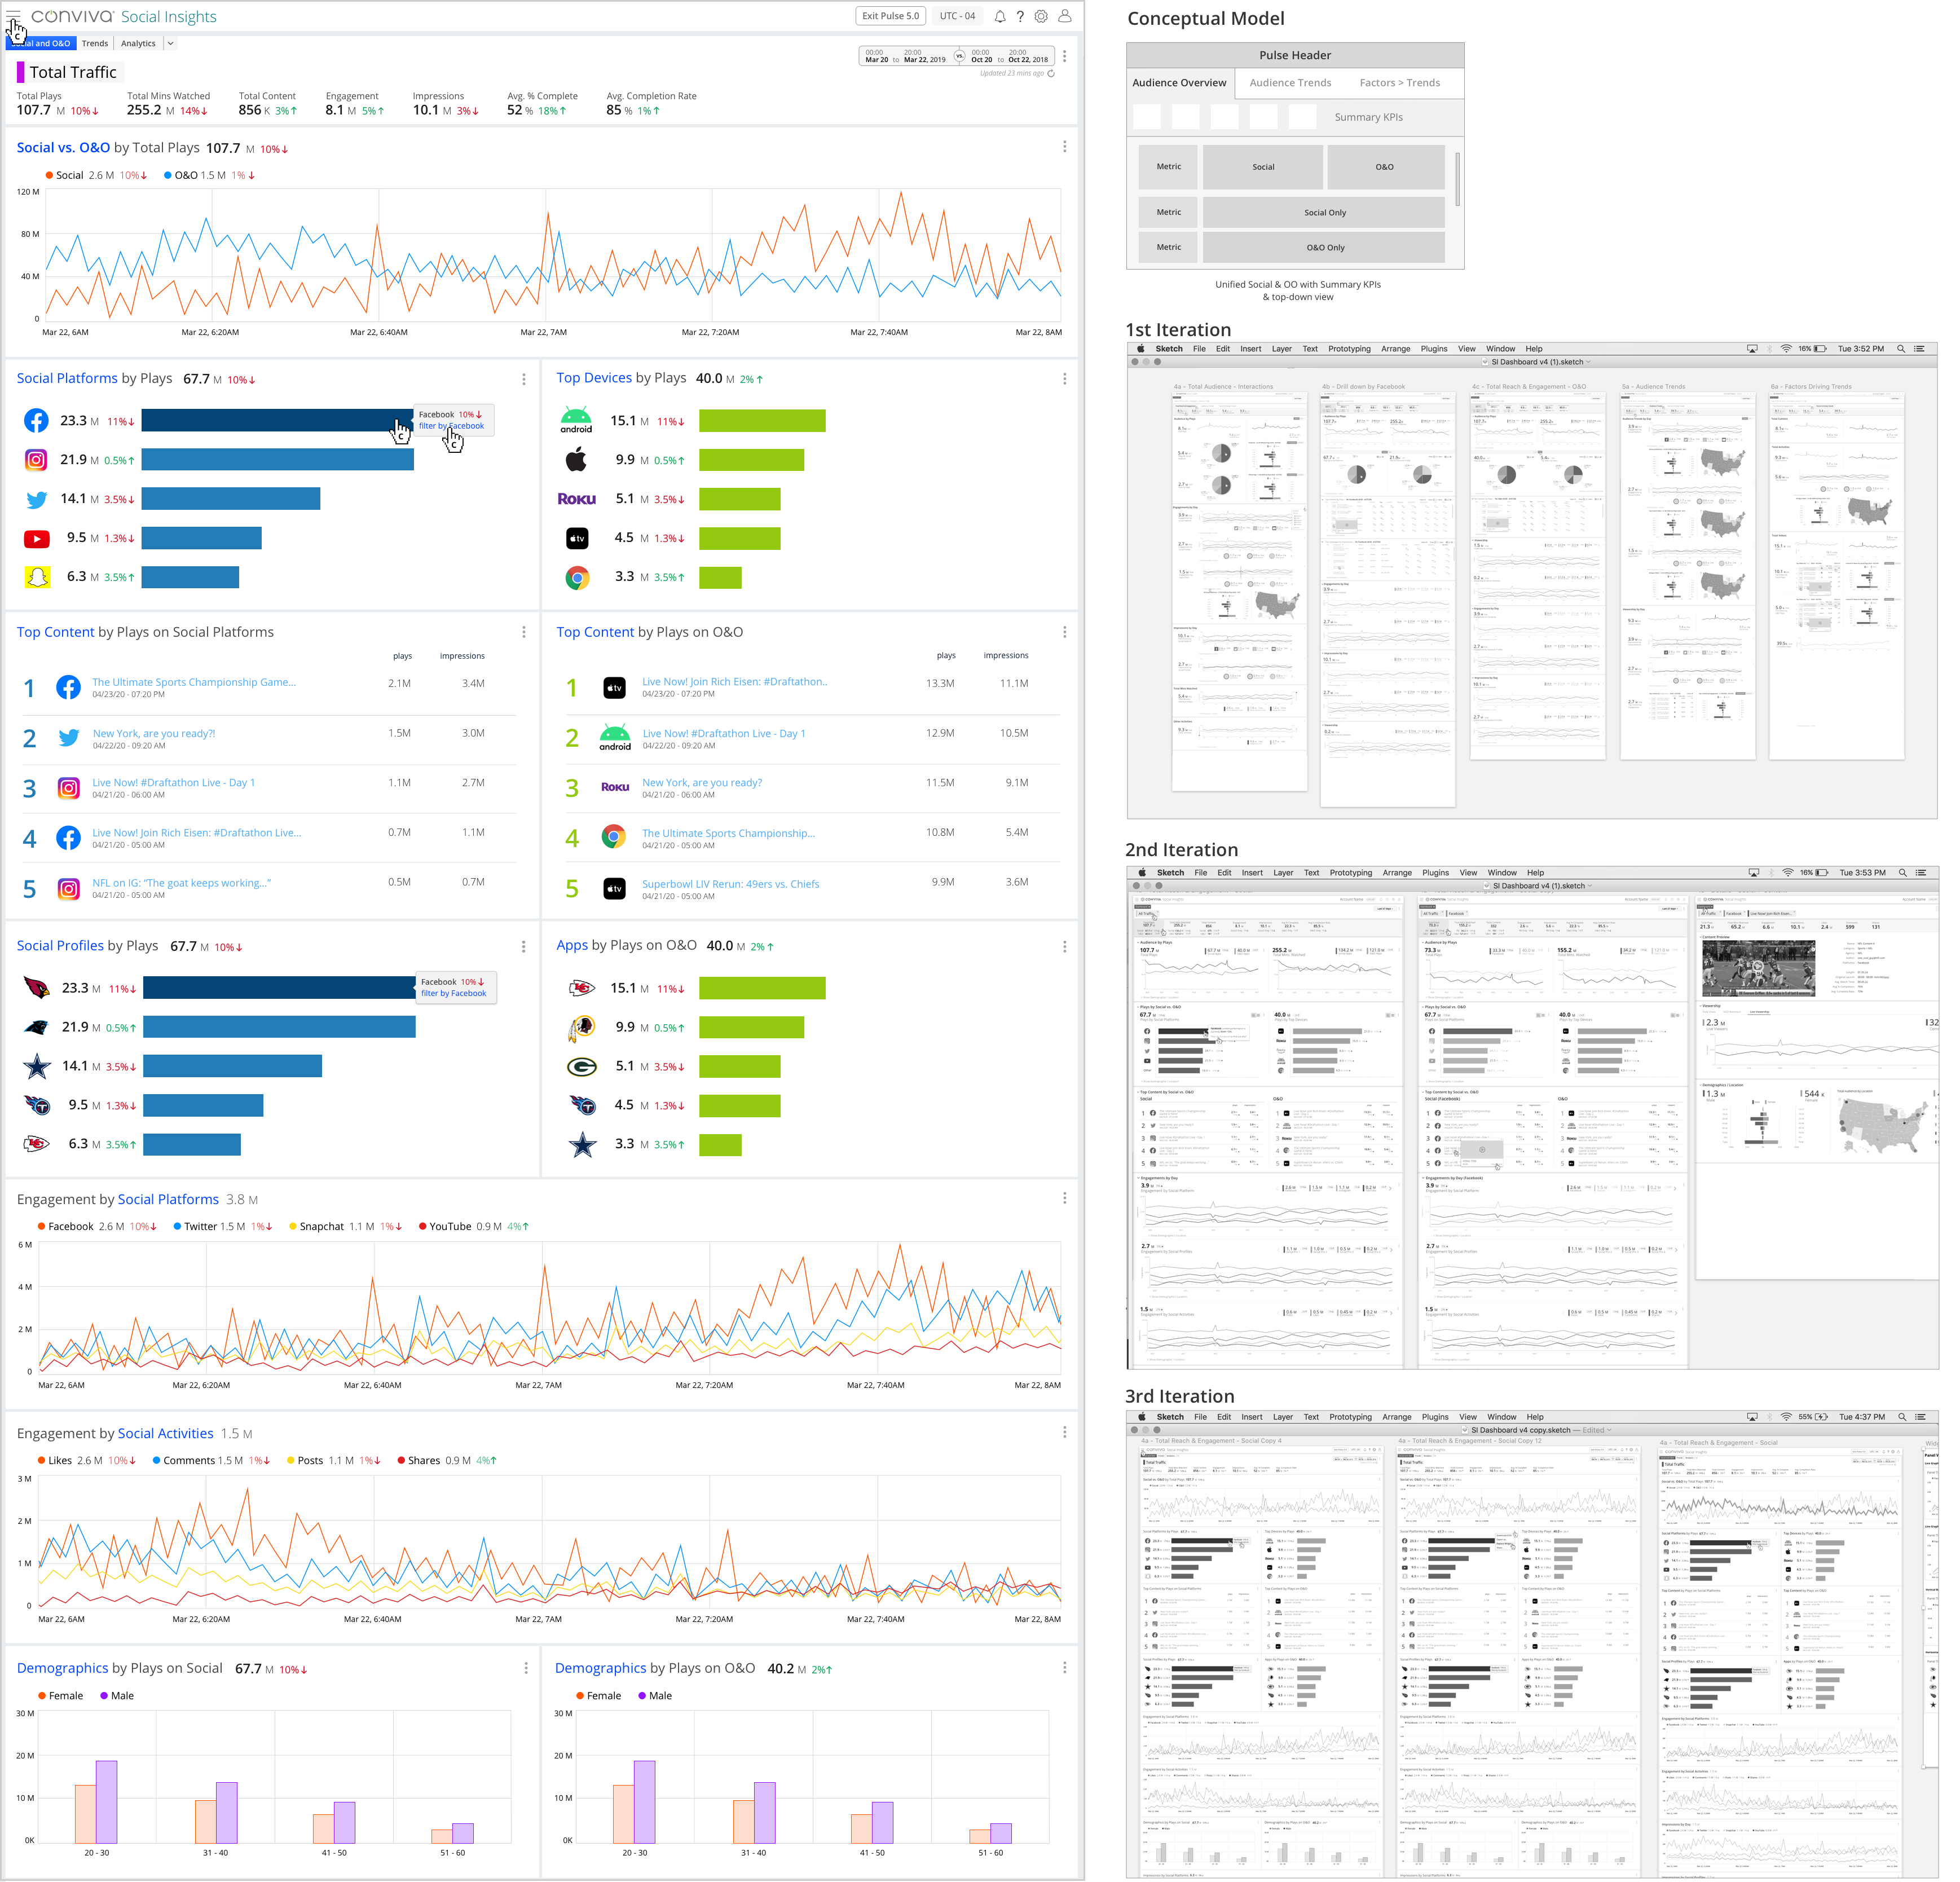
High-fidelity / Data Visualization
- Although I had designed for the flexibility of building out custom data visualizations for our advanced / tech savvy Business Managers, the Seans (Executive personas) of the world would need a good starting point, an out-of-the-box view. Engineering also needed a starting point to build out their initial framework so I put together some options.
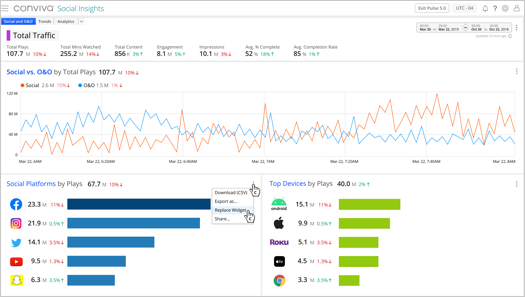
Prototypes
- After each iteration, I would put together an Invision prototype to share with Product, Engineering and Customers. Here's a quick overview of the Social Insights Dashboard showing some of the key interactions: Replace Widget from SI Dashboard, Creating a Widget and Saving a Widget.